Lipschitz functions: Fourier sums vs. Cesaro sums
In Maple we define
f := t -> |t|;
The associated Fourier sums are given by
S := proc (n, t) -> (1/2)*Pi-4*(sum(cos((2*j+1)*t)/(2*j+1)^2, j = 0 .. n))/Pi;
and the Cesaro sums are given by
C := proc (n, t) -> (1/2)*Pi-4*(sum((1-(2*j+1)/(n+1))*cos((2*j+1)*t)/(2*j+1)^2, j = 0 .. n))/Pi;
Then, we can plot both simultaneously
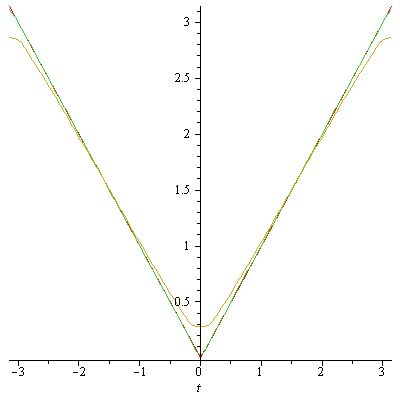
n := 10; plot([f(t), S(n, t), C(n, t)], t = -Pi .. Pi);
to obtain (we hope):

Notice that the green curve (Fourier sums) are approximating f
very well, whilst the yellow curve (Cesaro sums) are doind a much worse job.
Any explaination?
Let us try this with bigger n, and focus close to 0:
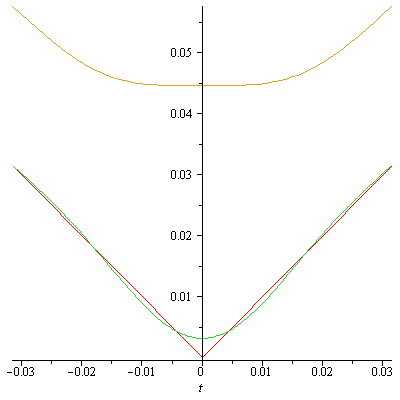
n := 100; plot([f(t), S(n, t), C(n, t)], t = -Pi/n .. Pi/n);
to obtain:

It still looks as if the Fourier sums are bettering the Cesaro sums.
