Graphs and Level Curves: Depicted using Maple
In Maple type
plot3d(abs(1-x^2+3*y^2), x = -3 .. 3, y = -3 .. 3);
to obtain (we hope):

Now let's see the level curves. In Maple type (or cut-and-paste, from here)
with(plots, implicitplot); implicitplot([0 = 1-x^2+3*y^2, 1/2 = abs(1-x^2+3*y^2), 1 = abs(1-x^2+3*y^2), 3/2 = abs(1-x^2+3*y^2), 2 = abs(1-x^2+3*y^2), x = 2], x = -3 .. 3, y = -3 .. 3, color = [green, red, yellow, blue, "Purple", "Pink"], legend = [k = 0, k = 1/2, k = 1, k = 3/2, k = 2, x = 2], gridrefine = 2)
to obtain:

Try to imagine how these level curves correspond to the graph depicted above. Imagine taking this plot of level curves, twisting clockwise by 135 degrees (by symmetry this will be the same as rotating 45 degrees counter-clockwise) and then pulling the bottom (left) corner towards yourself. The green curve at k=0 corresponds exactly to the trough in the graph.
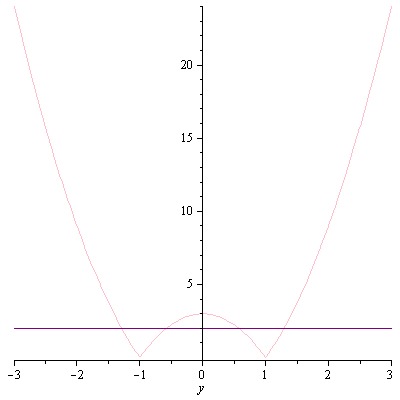
Now check-out the cross-section at x=2 . In Maple type
plot([abs(1-2^2+3*y^2),2], y = -3 .. 3, color = ["Pink","Purple"]);
to obtain:

Try to imagine intersecting the graph with a plane at x=2. The shape is similar to that seen at the edge of the graph at x=3. (Is this a surprise?) Moreover, the points y=-1,1, where the cross-section is zero, correspond exactly to the points where the pink line x=2, in the level curves plot, above, meets the green k=0 curve. Also the cross-section meets the value 2 at 4 points, as shown by intersection the purple z=2 line; these correspond exactly to the points of intersection of the pink line and the purple k=2 curve in the level curves plot, above.

