 is merely some subset of the sample space
 .
The following rules hold:
In the mathematical definition of probability, an arbitrary event
 is merely some subset of the sample space
 .
The following rules hold:

For any event

It is also obvious from our definitions in Chapter 2 that if
 and
and
 are two events with
 (that is, all of the simple events in
 are also in
 ),
then
 .
.
It is often helpful to use elementary ideas of set theory in dealing with
probability; as we show in this chapter, this allows certain rules or
propositions about probability to be proved. Before going on to specific
rules, we'll review Venn diagrams for sets. In the drawings below, think of
all points in
 being contained in the rectangle, and those points where particular events
occur being contained in circles. We begin by considering the union
 ,
intersection
 and complement
 of sets (see Figure aunionb). At the URL
http://stat-www.berkeley.edu/users/stark/Java/Venn.htm, there is an
interesting applet which allows you to vary the area of the intersection and
construct Venn diagrams for a variety of
purposes.

Top panel:
 means
means
 OR
OR
 (or possibly both)
occurs.
 is shaded.
Middle panel:
 (usually written as
 in probability) means
 and
and
 both occur.
 is shaded
Lower panel:
 means
means
 does not occur.
 is shaded
Example:
Suppose for students finishing 2A Math that 22% have a math average
 80%, 24% have a STAT 230 mark
 80%, 20% have an overall average
 80%, 14% have both a math average and STAT 230
 80%, 13% have both an overall average and STAT 230
 80%, 10% have all 3 of these averages
 80%, and 67% have none of these 3 averages
 80%. Find the probability a randomly chosen math student finishing 2A has math
and overall averages both
 80% and STAT 230
 80%.
80%.
Solution: When using rules of probability it is generally helpful to begin by labeling the events of interest.
 |
= |  |
|
 |
= |  |
|
 |
= |  |
In terms of these symbols, we are given
 ,
and
,
and
 .
We are asked to find
 ,
the shaded region in Figure maexample Filling in this
information on a Venn diagram, in the order indicated by (1), (2), (3),
etc.

Venn Diagram for Math
Averages Example
| (1) | given |
| (2) |  |
| (3) |  |
| (4) |  |
| (5) | unknown |
| (6) |  |
| (7) |  |
| (8) | given |
(Usually, we start filling in at the centre and work our way out.)
Adding
all probabilities and noting that
 ,
we can solve to get
 .
.
In a typical year, 20% of the days have a high temperature
 C.
On 40% of these days there is no rain. In the rest of the year, when the high
temperature
 C,
70% of the days have no rain. What percent of days in the year have rain and a
high temperature
 C?
C?
According to a survey of people on the last Ontario voters list, 55% are female, 55% are politically to the right, and 15% are male and politically to the left. What percent are female and politically to the right? Assume voter attitudes are classified simply as left or right.
In addition to the two rules which govern probabilities listed in Section 4.1, we have the following
(probability of
unions)
This can be obtained by using a Venn diagram. Each point in
 must be counted once. Since points in
 are counted twice - once in
 and once in
 - they need to be subtracted once.
 (see Figure
union)
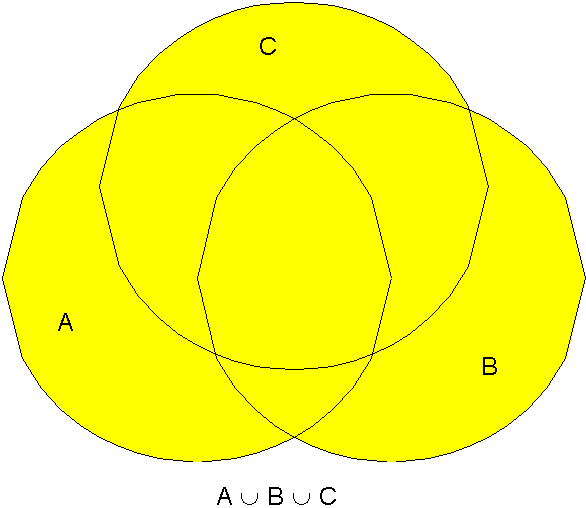
The union

 (where the subscripts are all different)
This generalization is seldom
used in Stat 230.
Events
 and
and
 are mutually exclusive if
 (the null set)
Since mutually exclusive events
 and
and
 have no common points,
 .
.
In general, events
 are mutually exclusive if
 for all
 .
This means that there is no chance of 2 or more of these events occurring
together. For example, if a die is rolled twice, the events
 are mutually exclusive. In the case of mutually exclusive events, rule 3 above
simplifies to rule 4 below.
Exercise:
Think of some pairs of events and classify them as being mutually exclusive or not mutually exclusive.
(unions of mutually exclusive events)
Let
 and
and
 be mutually exclusive events. Then

In general, let
 be mutually exclusive.
Then

Proof:
Use rule 3 above
(probability of complements)

Proof:
 and
and
 are mutually exclusive so

But


This result is useful whenever
 is easier to obtain than
 .
.
Example: Two ordinary dice are rolled. Find the probability that at least one of them turns up a 6.
Solution 1: Let
 = { 6 on the first die },
 = { 6 on the second die } and note (rule 3) that
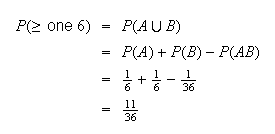 Solution 2:
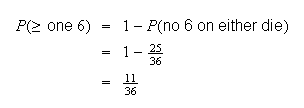
Example: Roll a die 3 times. Find the probability of getting
at least one 6.
Solution 1:
Let
 .
Then
 .
.
Using counting arguments, there are 6 outcomes on each roll, so
 has
has
 points. For
 to occur we can't have a 6 on any roll. Then
 can occur in
 ways.
ways.

| Solution 2: | Can you spot the flaw in this? |
| Let |  = {6 occurs on
 roll}
roll} |
 = {6 occurs on
 roll}
roll} |
|
 = {6 occurs on
 roll}.
 |
|
| \mbox{Then} |  |
=
 |
|
=
 |
You should have noticed that
 ,
and
,
and
 are not mutually exclusive events, so we should have
used
Each of
 ,
and
,
and
 occurs only once in the 36 point sample space for those two rolls.

Note: Rules 3, 4, and (indirectly) 5 link the concepts of addition, unions and complements. The next segment will consider intersection, multiplication of probabilities, and a concept known as independence. Making these linkages will make problem solving and the construction of probability models easier.
Problems:
Let
 and
and
 be events for which

(a)
Find the largest possible value for

(b)
For this largest value to occur, are the events
 and
and
 mutually exclusive, not mutually exclusive, or is this unable to be
determined?
Prove that

 for arbitrary events
 and
and
 in
in
 .
.
Consider these two groups of pairs of events.
| Group 1 | ||
 |
= | {airplane engine fails in flight} |
 |
= | {airplane reaches its destination safely} |
| or | (when a fair coin is tossed twice) | |
 |
= | { is on 1st toss}
 |
 |
= | { on both tosses}.
 |
| Group 2 | ||
 |
= | {a coin toss shows heads} |
 |
= | {a bridge hand has 4 aces}. |
| or | (when a fair coin is tossed twice) | |
 |
= | { on 1st toss}
 |
 |
= | { on 2nd toss}
 |
What do the pairs
 in each group have in common? In group 1 the events are related so that the
occurrence of
 affects the chances of
 occurring. In group 2, whether
 occurs or not has no effect on
 's
occurrence.
We call the pairs in group 1 dependent events, and those in group 2 independent events. We formalize this concept in the mathematical definition which follows.
Events
 and
and
 are independent if and only if
 .
If they are not independent, we call the events
dependent.
If two events are independent, then the ``size'' of their intersection as
measured by the probability measure is required to be the product of the
individual probabilities. This means, of course, that the intersection must be
non-empty, and so the events are not mutually exclusive. For example in the
Venn diagram depicted in Figure independent,
 and
and
 so in this case the two events are independent.
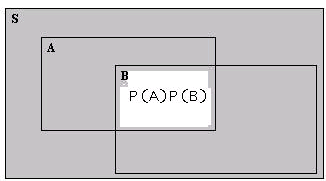
Independent events

For another example, suppose we toss a fair coin twice. Let
 = {head on 1st toss} and
 = {head on 2nd toss}. Clearly
 and
and
 are independent since the outcome on each toss is unrelated to other tosses,
so
 .
.
However, if we roll a die once and let
 = {the number is even} and
 = {number
 }
the events will be dependent since
 (Rationale:
 only happens half the time. If
 occurs we know the number is 2, 4, or 6. So
 occurs
 of the time when
 occurs. The occurrence of
 does affect the chances of
 occurring so
 and
and
 are not independent.)
When there are more than 2
events, the above definition generalizes to:
The events
 are independent if and only
if
 for all sets
 of distinct subscripts chosen from

For example, for
 ,
we need

and

Technically, we have defined ``mutually independent'' events, but we will shorten the name to ``independent'' to reduce confusion with ``mutually exclusive.''
The definition of independence works two ways. If we can find
 ,
and
,
and
 then we can determine whether
 and
and
 are independent. Conversely, if we know (or assume) that
 and
and
 are independent, then we can use the definition as a rule of probability to
calculate
 .
Examples of each follow.
Example: Toss a die twice. Let
 = {first toss is a 3} and
 = {the total is 7}. Are
 and
and
 independent? (What do you think?) Using the definition to check, we get
 (points (1,6), (2,5), (3,4), (4,3), (5,2) and (6,1) give a total of 7) and
 (only the point (3,4) makes
 occur).
Therefore,
 and so
 and
and
 are independent events.
Now suppose we change
 to the event {total is 8}.
Then

and consequently
 and
and
 are dependent events.
This example often puzzles students. Why are they independent if
 is a total of 7 but dependent for a total of 8? The key is that regardless of
the first toss, there is always one number on the 2nd toss which makes the
total 7. Since the probability of getting a total of 7 started off being
 ,
the outcome of the 1st toss doesn't affect the chances. However, for any total
other than 7, the outcome of the 1st toss does affect the chances of getting
that total (e.g., a first toss of 1 guarantees the total cannot be
8).
Example: A (pseudo) random number
generator on the computer can give a sequence of independent random digits
chosen from
 .
This means that (i) each digit has probability of
 of being any of
 ,
and (ii) the outcomes for the different trials are independent of one another.
We call this type of setting an "experiment with independent trials".
Determine the probability that
in a sequence of 5 trials, all the digits generated are odd
the number 9 occurs for the first time on trial 10.
Solution:
Define the events
 = {digits from trial
 is odd},
 .
.
Then
 since the
 's
are mutually independent. Since
 ,
we get
 (all
digits are odd) =
 .
.
Define events
 = {9 occurs on trial
 },
},
 .
Then we want
 because the
 's
are independent, and
 .
.
Note: We have used the fact here that if
 and
and
 are independent events, then so are
 and
and
 .
To see this note that

Note: We have implicitly assumed independence of
events in some of our earlier probability calculations. For example, suppose a
coin is tossed 3 times, and we consider the sample space
 Assuming that the outcomes on the three tosses are independent, and that
 on any single toss, we get that
 Similarly, all the other simple events have probability
 .
Note that in earlier calculations we assumed this was true without thinking
directly about independence. However, it is clear that if somehow the 3 tosses
were not independent then it might be a bad idea to assume each simple event
had probability
 .
(For example, instead of heads and tails, suppose
 stands for "rain" and
 stands for "no rain" on a given day; now consider 3 consecutive days. Would
you want to assign a probability of
 to each of the 8 simple events?)
Note: The definition of independent events can thus be used
either to check for independence or, if events are known to be independent, to
calculate
 .
Many problems are not obvious, and scientific study is needed to determine if
two events are independent. For example, are the events
 and
and
 independent if, for a random child living in a country,
 = {live within 5 km. of a nuclear power plant}
 = {a child has leukemia}?
Such problems, which are of considerable
importance, can be handled by methods in later statistics courses.
A weighted die is such that
 and
and

If the die is thrown twice what is the probability the total is 9?
If a die is thrown twice, and this process repeated 4 times, what is the probability the total will be 9 on exactly 1 of the 4 repetitions?
Suppose among UW students that 15% speaks French and 45% are women. Suppose also that 20% of the women speak French. A committee of 10 students is formed by randomly selecting from UW students. What is the probability there will be at least 1 woman and at least 1 French speaking student on the committee?
Prove that
 and
and
 are independent events if and only if
 and
and
 are independent.
In many situations we may want to determine the probability of some event
 ,
while knowing that some other event
 has already occurred. For example, what is the probability a randomly selected
person is over 6 feet tall, given that they are female? Let the symbol
 represent the probability that event
 occurs, when we know that
 occurs. We call this the conditional probability of
 given
given
 .
While we will give a definition of
 ,
let's first consider an example we looked at earlier, to get some sense of why
 is defined as it is.
Example: Suppose we roll a die once. Let
 = {the number is even} and
 = {number
 }.
If we know that
 occurs, that tells us that we have a 4, 5, or 6. Of the times when
 occurs, we have an even number
 of the time. So
 .
More formally, we could obtain this result by calculating
 ,
since
 and
and
 .
.
the conditional probability of event
 ,
given event
 ,
is
,
is
Note: If
 and
and
 are
independent,
 This makes sense, and can be taken as an equivalent definition of
independence; that is,
 and
and
 are independent iff
 .
You should investigate the behaviour of the conditional probabilities as we
move the events around on the web-site
http://stat-www.berkeley.edu/%7Estark/Java/Venn3.htm.
Example: If a fair coin is tossed 3 times, find the
probability that if at least 1 Head occurs, then exactly 1 Head
occurs.
Solution: Define the events
 = {1 Head},
 = {at least 1 Head}. What we are being asked to find is
 .
This equals
 ,
and so we find
 and
and
 using either the sample space with 8 points, or the fact that the 3 tosses are
independent. Thus,

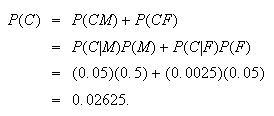
Example: The probability a randomly selected
male is colour-blind is .05, whereas the probability a female is colour-blind
is only .0025. If the population is 50% male, what is the fraction that is
colour-blind?
Solution: Let
 |
= | {person selected is colour-blind} |
 |
= | {person selected is male} |
 |
= | {person selected is female} |
 .
We are told that
 To get
 we can therefore
use
The preceding example suggests two more probability rules, which turn out to be extremely useful. They are based on breaking events of interest into pieces.
Multiplication Rules
Let
 be
arbitrary events in a sample space.
Then
and so on.
Proof:
The first rule comes directly from the definition
 .
The right hand side of the second rule equals (assuming
 )
)
 and so on.
Partition Rule
Let
 be
a partition of the sample space
 into
disjoint (mutually exclusive) events such
that
 Let
Let
 be
an arbitrary event in
 .
Then
 Proof: Look at a Venn diagram to see that
 are mutually exclusive, with
 .
.
Example: In an insurance portfolio 10% of the policy
holders are in Class
 (high risk), 40% are in Class
 (medium risk), and 50% are in Class
 (low risk). The probability a Class
 policy has a claim in a given year is .10; similar probabilities for Classes
 and
and
 are .05 and .02. Find the probability that if a claim is made, it is for a
Class
 policy.
Solution:
For a randomly selected policy, let
 |
= | {policy has a claim } |
 |
= | {policy is of Class
 }, },
 |
 .
Note that
 and that
 We are told
that
 and that
 Thus
Thus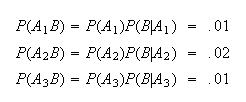
Therefore
 and
and
 .
.
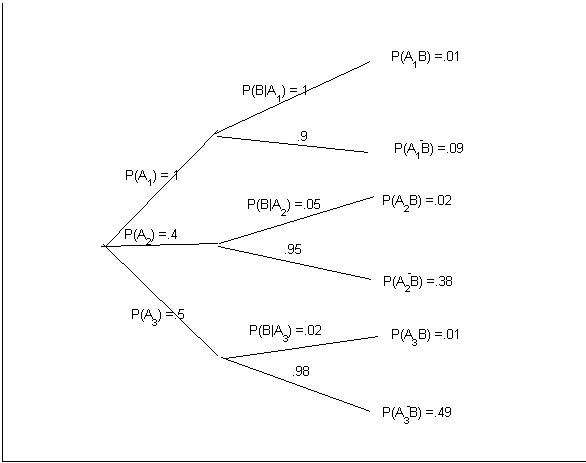
Tree diagrams can be a useful device for keeping track of conditional probabilities when using multiplication and partition rules. The idea is to draw a tree where each path represents a sequence of events. On any given branch of the tree we write the conditional probability of that event given all the events on branches leading to it. The probability at any node of the tree is obtained by multiplying the probabilities on the branches leading to the node, and equals the probability of the intersection of the events leading to it.
For example, the immediately preceding example could be represented by the
tree in Figure treetest. Note that the probabilities
on the terminal nodes must add up to 1.
Here is another example
involving diagnostic tests for disease. See if you can represent the problem
by a tree.
Example. Testing for HIV
Tests used to
diagnose medical conditions are often imperfect, and give false positive or
false negative results, as described in Problem 2.6 of Chapter 2. A fairly
cheap blood test for the Human Immunodeficiency Virus (HIV) that causes AIDS
(Acquired Immune Deficiency Syndrome) has the following characteristics: the
false negative rate is 2% and the false positive rate is 0.5%. It is assumed
that around .04% of Canadian males are infected with HIV.
Find the probability that if a male tests positive for HIV, he actually has HIV.
Solution: Suppose a male is randomly selected from the
population, and define the events
 |
= | {person has HIV} |
 |
= | {blood test is positive} |
 .
From the information given we know that
 Therefore we can find
 and
and
 Thus, if a randomly selected male tests positive, there is still only a small
probability (.0727) that they actually have HIV!
Exercise: Try to explain in ordinary words why this is the case.
Note: Bayes Theorem
By using the definition of conditional probability and the multiplication
rule, we get that
 This result is called Bayes Theorem, after a
mathematician Note_1 who proved it
in the 1700's. It is a very trivial theorem, but it has inspired approaches to
problems in statistics and other areas such as machine learning,
classification and pattern recognition. In these areas the term "Bayesian
methods" is often used.
If you take a bus to work in the morning there is a 20% chance you'll arrive late. When you go by bicycle there is a 10% chance you'll be late. 70% of the time you go by bike, and 30% by bus. Given that you arrive late, what is the probability you took the bus?
A box contains 4 coins -- 3 fair coins and 1 biased coin for which
 (heads)
= .8. A coin is picked at random and tossed 6 times. It shows 5 heads. Find
the probability this coin is fair.
At a police spot check, 10% of cars stopped have defective headlights and a faulty muffler. 15% have defective headlights and a muffler which is satisfactory. If a car which is stopped has defective headlights, what is the probability that the muffler is also faulty?
If
 and
and
 are mutually exclusive events with
 and
and
 ,
find the probability of each of the following events:

Three digits are chosen at random with replacement from
 ;
find the probability of each of the following events.
 :
``the digits are all nonzero''; :
``the digits are all nonzero''; |
|
 :
``all three digits are the same''; :
``all three digits are the same''; |
 :
``the digits all exceed 4''; :
``the digits all exceed 4''; |
 :
``all three digits are different''; :
``all three digits are different''; |
 ``digits all have the same parity (all odd or all even)''.
 |
Then find the probability of each of the following events, which are
combinations of the previous five events:
 Show the last two of these events in Venn diagrams.
Let
 and
and
 be events defined on the same sample space, with
 ,
,
 and
and
 .
Given that event
 does not occur, what is the probability of event
 ?
?
A die is loaded to give the probabilities:
| number | 1 | 2 | 3 | 4 | 5 | 6 |
| probability | .3 | .1 | .15 | .15 | .15 | .15 |
The die is thrown 8 times. Find the probability
1 does not occur
2 does not occur
neither 1 nor 2 occurs
both 1 and 2 occur.
Events
 and
and
 are independent with
 and
and
 .
Find
 .
.
Students
 and
and
 each independently answer a question on a test. The probability of getting the
correct answer is .9 for
 ,
.7 for
 and .4 for
 .
If 2 of them get the correct answer, what is the probability
 was the one with the wrong answer?
70% of the customers buying at a certain store pay by credit card. Find the probability
3 out of 5 customers pay by credit card
the 5th customer is the 3rd one to pay by credit card.
Let
 and
and
 be independent with
 and
and
 .
Prove that either
 or else
 .
.
In a large population, people are one of 3 genetic types
 and
and
 :
30% are type
 ,
60% type
 and 10% type
 .
The probability a person carries another gene making them susceptible for a
disease is .05 for
 ,
.04 for
 and .02 for
 .
If ten unrelated persons are selected, what is the probability at least one is
susceptible for the disease?
Two baseball teams play a best-of-seven series, in which the series ends as
soon as one team wins four games. The first two games are to be played on
 's
field, the next three games on
 's
field, and the last two on
 's
field. The probability that
 wins a game is 0.7 at home and 0.5 away. Find the probability that:
 wins the series in 4 games; in 5 games;
the series does not go to 6 games.
A population consists of
 females and
 males; the population includes
 female smokers and
 male smokers. An individual is chosen at random from the population. If
 is the event that this individual is female and
 is the event he or she is a smoker, find necessary and sufficient conditions
on
 ,
,
 ,
,
 and
and
 so that
 and
and
 are independent events.
An experiment has three possible outcomes
 ,
,
 and
and
 with respective probabilities
 ,
,
 and
and
 ,
where
 .
The experiment is repeated until either outcome
 or outcome
 occurs. Show that
 occurs before
 with probability
 .
.
In the game of craps, a player rolls two dice. They win at once if the total
is 7 or 11, and lose at once if the total is 2, 3, or 12. Otherwise, they
continue rolling the dice until they either win by throwing their initial
total again, or lose by rolling 7.
Show that the probability they win is
0.493.
(Hint: You can use the result of Problem 4.12)
A researcher wishes to estimate the proportion
 of university students who have cheated on an examination. The researcher
prepares a box containing 100 cards, 20 of which contain Question A and 80
Question B.
Question A: Were you born in July or August?
Question B: Have you ever cheated on an examination?
Each student who is
interviewed draws a card at random with replacement from the box and answers
the question it contains. Since only the student knows which question he or
she is answering, confidentiality is assured and so the researcher hopes that
the answers will be
truthful Note_2 . It is known that
one-sixth of birthdays fall in July or August.
What is the probability that a student answers `yes'?
If
 of
of
 students answer `yes', estimate
 .
.
What proportion of the students who answer `yes' are responding to Question B?
Diagnostic tests. Recall the discussion of diagnostic tests
in Problem 2.6 for Chapter 2. For a randomly selected person let
 `person has the disease' and
 `the test result is positive'. Give estimates of the following probabilities:
 ,
,
 ,
,
 .
.
Slot machines. Standard slot machines have three wheels, each marked with some number of symbols at equally spaced positions around the wheel. For this problem suppose there are 10 positions on each wheel, with three different types of symbols being used: flower, dog, and house. The three wheels spin independently and each has probability 0.1 of landing at any position. Each of the symbols (flower, dog, house) is used in a total of 10 positions across the three wheels. A payout occurs whenever all three symbols showing are the same.
If wheels 1, 2, 3 have 2, 6, and 2 flowers, respectively, what is the probability all three positions show a flower?
In order to minimize the probability of all three positions showing a flower, what number of flowers should go on wheels 1, 2 and 3? Assume that each wheel must have at least one flower.
Spam detection 1. Many methods of spam detection are based on
words or features that appear much more frequently in spam than in regular
email. Conditional probability methods are then used to decide whether an
email is spam or not. For example, suppose we define the following events
associated with a random email message.
| Spam | = | "Message is spam" |
| Not Spam | = | "Message is not spam ("regular")" |
| A | = | "Message contains the word Viagra" |
 (Spam),
 Spam) and
 Not Spam), then we can find the probabilities
 (Spam
(Spam and
and
 (Not
Spam
 .
.
From a study of email messages coming into a certain system it is estimated
that
 (Spam)
= .5,
 Spam)
= .2, and
 Not
Spam) = .001. Find
 (Spam
(Spam and
and
 (Not
Spam
 .
.
If you declared that any email containing the word Viagra was Spam, then find what fraction of regular emails would be incorrectly identified as Spam.
Spam detection 2. The method in part (b) of the preceding
question would only filter out 20% of Spam messages. (Why?) To increase the
probability of detecting spam, we can use a larger set of email "features";
these could be words or other features of a message which tend to occur with
much different probabilities in spam and in regular email. (From your
experience, what might be some useful features?) Suppose we identify
 binary features, and define events
 = feature
 appears in a message.
We will assume that
 are independent events, given that a message is spam, and that they are also
independent events, given that a message is regular.
Suppose
 and that
 Spam)
= .2 Spam)
= .2 |
 Not
Spam) = .005 Not
Spam) = .005 |
||
 Spam)
= .1 Spam)
= .1 |
 Not
Spam) = .004 Not
Spam) = .004 |
||
 Spam)
= .1 Spam)
= .1 |
 Not
Spam) = .005 Not
Spam) = .005 |
Assume as in the preceding question that
 (Spam)
= .5.
Suppose a message has all of features 1, 2, and 3 present. Determine
 (Spam
(Spam
 .
.
Suppose a message has features 1 and 2 present, but feature 3 is not present.
Determine
 (Spam
(Spam
 ).
).
If you declared as spam any message with one or more of features 1, 2 or 3 present, what fraction of spam emails would you detect?
Online fraud detection. Methods like those in problems 4.17
and 4.18 are also used in monitoring events such as credit card transactions
for potential fraud. Unlike the case of spam email, however, the fraction of
transactions that are fraudulent is usually very small. What we hope to do in
this case is to "flag" certain transactions so that they can be checked for
potential fraud, and perhaps to block (deny) certain transactions. This is
done by identifying features of a transaction so that if
 = "transaction is fraudulent",
then
 is large.
Suppose
 =0.0005 and that
 feature
present
 .
Determine
 feature present) as a function of
 ,
and give the values when
 ,
, and
and
 .
.
Suppose
 and you decide to flag transactions with the feature present. What percentage
of transactions would be flagged? Does this seem like a good idea?